When discussing asylum seekers it is important to have an accurate understanding of the statistics. A search for statistics on push vs. pull factors brings up the following Crikey blog post:
http://blogs.crikey.com.au/pollytics/2009/10/19/push-vs-pull-asylum-seeker-numbers-and-statistics/
A graph from this post is frequently cited to show that the number of boat arrivals in Australia is mainly caused by worldwide factors and not government policy.
The problem, however, is that this graph is based on factual errors and fudged statistics. Furthermore it was created before the data for 2009-2010 was available, and therefore it does not contain the only 2 complete years since the Rudd government changed the policies in the second half of 2008.
Documented below are the errors in the original graph, data added for the 2009-2010 period as well as a graph showing the raw data.
Inaccurate 2002 data
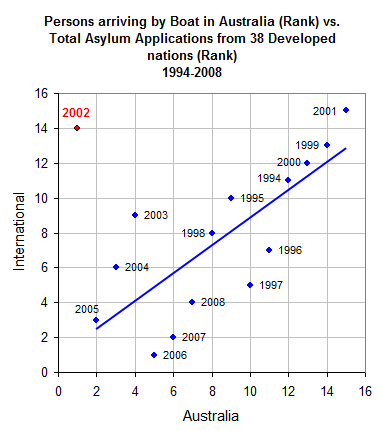
The author first provides their original graph showing rankings of worldwide numbers vs. Australian numbers:
The author then fudges the 2002 figures so that the data point fits more easily into their graph. But their new figures are based on factual errors.
Factual error 1 “(The Pacific Solution) did reduce numbers – by redefining parts of Australia as not actually being Australia. Any boat people that happened to land were conveniently excluded from the statistics by an act of definition.”
This assumption is incorrect. The Parliamentary Library document below states, “Data from 2001–02 onwards includes arrivals at both excised and non‐excised places.”
http://www.aph.gov.au/library/pubs/bn/sp/BoatArrivals.pdf
Factual error 2 “Yet we know that SIEV(s) 5,7,11 and 12 in 2002 attempted to make the journey and were returned to Indonesia while SIEV(s) 4,6 and 10 actually sank. That was in very late 2001 through late 2002.”
The suggestion that some of these SIEV(s) attempted to make the journey in 2002 is false. As reported to the senate committee, they arrived between 7 September 2001 and 16 December 2001. So to increase the 2002 figure to include these asylum seekers is not valid. The report asserts that “Twelve Suspected Illegal Entry Vessels (SIEVs) were intercepted by the RAN under the auspices of Operation Relex.[1521] SIEV 1 arrived on 7 September 2001 and the last illegal entry vessel, SIEV 12, arrived on 16 December 2001.”
http://www.aph.gov.au/senate/committee/maritime_incident_ctte/report/f04.htm
Further proof comes from the table below that lists the boats on which the “Pacific Solution” asylum seekers arrived. All boats listed arrived in 2001. This confirms that it is inaccurate to assert that these asylum seekers arrived in 2002. They were in detention in 2002, but they arrived on boats in 2001.
Interestingly this was pointed out to the author by someone in the comments of the original post. Unfortunately the author didn’t take the point seriously enough to investigate and find that their figures were incorrect.
Numbers at Nauru and Manus 16 April 2002
| Nauru | |
| MV Tampa & SIEV 1 | 525 |
| SIEV 2 & SIEV 3 | 271 |
| SIEV6, SIEV 9 & SIEV10 | 359 |
| Total Nauru | 1155 |
| Manus | |
| SIEV 4 | 216 |
| Transferred from Christmas Island 26-27 January | 140 |
| Total Manus | 356 |
| Total | 1511 |
http://www.aph.gov.au/senate/committee/maritime_incident_ctte/report/c10.htm
MV Tampa and SIEV(s) 1-12 arrived in 2001.
So 2002 is the outlier suggested in the original graph, and as such cannot be fudged to fit the graph as the author has attempted to do.
Recent data
We now have more data to place into the original graph as the complete statistics for 2009 and 2010 are available.
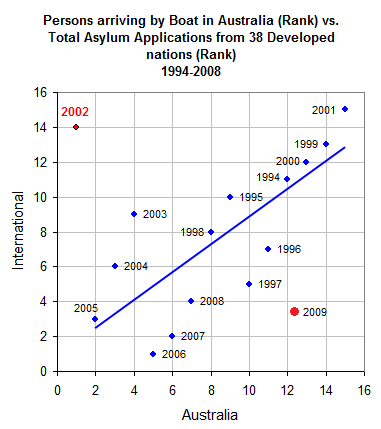
Let’s superimpose the 2009 data onto the graph. We can see that in 2009 there is a significant imbalance between the worldwide number and Australian boat arrivals. It ranks as only the 4th year internationally, yet the 13th year for Australian boat arrivals:
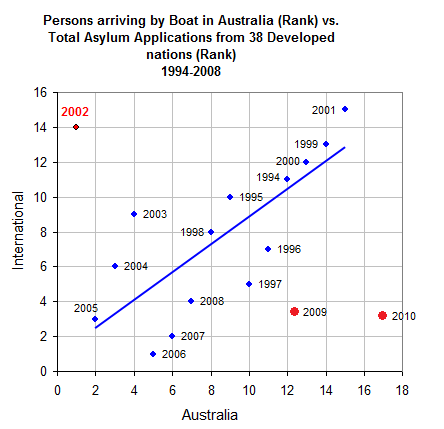
Now let’s look to the data for 2010. In 2010 Australia recorded the highest ever number of arrivals by boat.
The UNHCR has released complete data for 2010 which ranks it as the 4th lowest year worldwide (moving 2009 to the 5th lowest).
As shown below, 2010 falls well outside the expected range in the graph. Clearly something significant happened just before 2009-2010 to produce these results, as it did in 2001 to produce the 2002 result. And in both cases it was a change in government policy.
Graphing the raw data
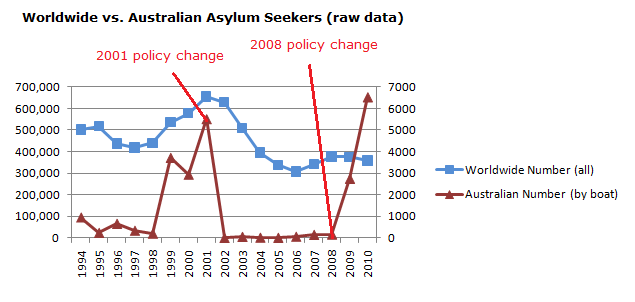
The choice of graph selected by the author is deceptive. By ranking the data instead of presenting the raw figures, the author is able to hide the significant drop and rise at the times of policy changes. Below is a graph showing the raw data, and while there is a good correlation between the worldwide number and the Australian number, there are years where there are dramatic changes to the Australian number and only minor changes to the worldwide number:
Note the significant effect of policy change. When John Howard announced in 2001 that Australia was getting tougher, the numbers dropped significantly. When Kevin Rudd announced in 2008 that Australia was getting softer, the numbers jumped significantly and continue to rise. Also note the low numbers during the time of the Howard government Pacific Solution policy, when the worldwide number was ~300,000-600,000.
In addition see that the worldwide numbers from 2008-2010 decreased, while the Australian number went from 161 people to 6535 (a 40 fold increase). What this tells us is that while push factors have an effect on numbers in Australia, pull factors in the form of government policy have a much more pronounced effect.
Links:
Worldwide 2010 figures (UNHCR Jan-Dec 2010):
http://www.unhcr.org/4d8c5b109.html
Australian 2010 figures:
http://au.news.yahoo.com/thewest/a/-/wa/8598042/first-asylum-boat-of-2011-stopped


